Roughness Rose plots
[3]:
pwio.plot.roughness_rose(rou_rose)
[4]:
pwio.plot.roughness_rose(rou_rose, gap=True)
[5]:
pwio.plot.roughness_rose(rou_rose, style="bar")
[6]:
pwio.plot.roughness_rose(rou_rose, style="bar", gap=True)
Wind rose plots
[7]:
pwio.plot.wind_rose(bwc_from_ts, "IEC_I")
/home/btol/miniforge3/envs/btol/lib/python3.11/site-packages/plotly/express/_core.py:2065: FutureWarning:

When grouping with a length-1 list-like, you will need to pass a length-1 tuple to get_group in a future version of pandas. Pass `(name,)` instead of `name` to silence this warning.
[8]:
pwio.plot.wind_rose(bwc_from_wwc, [0, 5, 10, 15, 30], style = "radar")
/home/btol/miniforge3/envs/btol/lib/python3.11/site-packages/plotly/express/_core.py:2065: FutureWarning:

When grouping with a length-1 list-like, you will need to pass a length-1 tuple to get_group in a future version of pandas. Pass `(name,)` instead of `name` to silence this warning.
[9]:
pwio.plot.wind_rose(bwc_from_wwc, "IEC_I", cmap="inferno", gap=True)
/home/btol/miniforge3/envs/btol/lib/python3.11/site-packages/plotly/express/_core.py:2065: FutureWarning:

When grouping with a length-1 list-like, you will need to pass a length-1 tuple to get_group in a future version of pandas. Pass `(name,)` instead of `name` to silence this warning.
[10]:
pwio.plot.wind_rose(wwc_pt, "IEC_I", cmap="inferno", gap=True) #works for a wwc as input
/home/btol/miniforge3/envs/btol/lib/python3.11/site-packages/plotly/express/_core.py:2065: FutureWarning:

When grouping with a length-1 list-like, you will need to pass a length-1 tuple to get_group in a future version of pandas. Pass `(name,)` instead of `name` to silence this warning.
[11]:
# bwc is missing some attributes so raises a validation error
try:
    pwio.plot.wind_rose(bwc)
except PlottingAttrsError as e:
    print(e)
The plot can't be displayed as the following attributes are not defined for 'sector' :
1. Missing attribute value: 'long_name'
2. Missing attribute value: 'units'
Please, define a value for the empty attributes.
Weibull distributions and histograms
[13]:
pwio.plot.histogram(bwc_from_ts, style="faceted", color = "green", weibull = True)
[14]:
pwio.plot.histogram(bwc_from_ts, style="faceted", color = "green", weibull = True, share_xaxes=False)
[15]:
pwio.plot.histogram(bwc_from_ts, style="list", gap = True)[10]
[16]:
#weibull argument displays or not weib. distrib.
pwio.plot.histogram(bwc_from_wwc.isel(sector=[0,3]), style="list", weibull = False)[1]
[17]:
# Emergent distribution
pwio.plot.histogram(bwc_from_ts, emergent_distribution=True)
[18]:
pwio.plot.histogram_lines(bwc_from_ts)
/home/btol/miniforge3/envs/btol/lib/python3.11/site-packages/plotly/express/_core.py:2065: FutureWarning:

When grouping with a length-1 list-like, you will need to pass a length-1 tuple to get_group in a future version of pandas. Pass `(name,)` instead of `name` to silence this warning.
[19]:
# bwc is missing attributes
try:
    pwio.plot.histogram_lines(bwc)
except PlottingAttrsError as e:
    print(e)
The plot can't be displayed as the following attributes are not defined for 'sector' :
1. Missing attribute value: 'long_name'
2. Missing attribute value: 'units'
Please, define a value for the empty attributes.
[20]:
# input must be valid bwc, wwc is not accepted
try:
    pwio.plot.histogram(wwc_pt, style = "faceted", weibull = None)
except pwio._errors.WindClimateValidationError as e:
    print(e)
validate found 2 errors
1. Missing variable: wsfreq
2. Missing dimension: wsbin
Operational curves
[22]:
pwio.plot.single_curve(wtg_test.power_output, style = "faceted", color = "dodgerblue", x_axis_range= [1,29.5])
[23]:
pwio.plot.power_ct_curves(wtg_test, mark_rated = 0.5, x_axis_range= [3,28], title = True)
[24]:
pwio.plot.power_ct_curves(wtg_test.sel(mode = "Standard"), mark_rated = 0.95, share_yaxes =True, x_axis_range= [1,28], title = True)
[25]:
# Don't share the y-axis, which changes the view of the power curves for this artificial case
pwio.plot.power_ct_curves(wtg_test, mark_rated = True, share_yaxes =False, title = True)
Vertical profile
[29]:
vp = xr.open_dataset("data/plots/vertical_profile.nc")
vp["height"].attrs = {"long_name" : "Height above the ground", "units" : "m"}
[30]:
pwio.plot.vertical_profile(vp.isel(time=0).wind_speed, vp.isel(time=1).wind_speed)
[31]:
pwio.plot.vertical_profile(da_meas=vp.isel(time=1).wind_direction)
[32]:
pwio.plot.vertical_profile(da_pred=vp.isel(time=1).wind_direction)
Map Plots
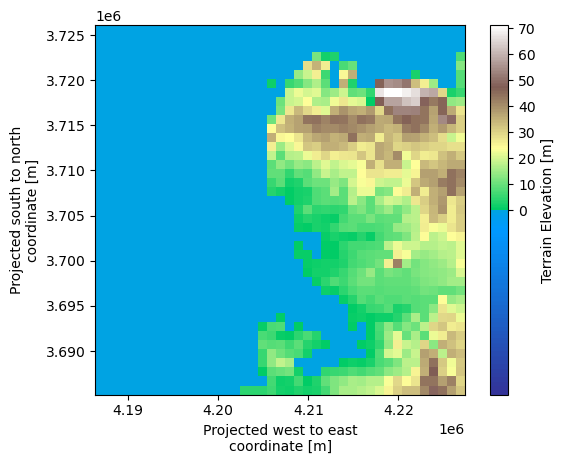
Raster map
[33]:
plot_dat = site_effects_squeezed["site_elev"]
pwio.plot.raster_plot(plot_dat);
[34]:
pwio.plot.raster_plot(landcover)
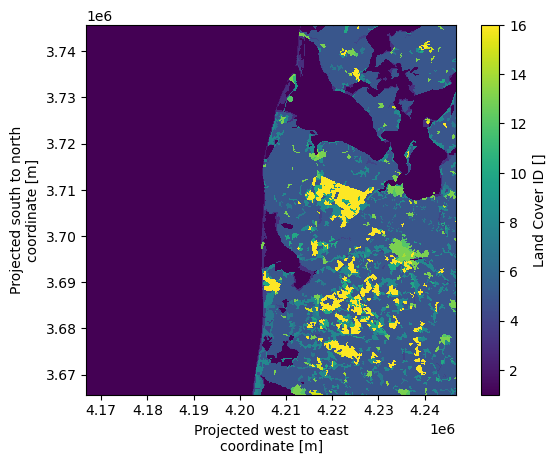
[34]:
<matplotlib.collections.QuadMesh at 0x7fd9e00c4e10>
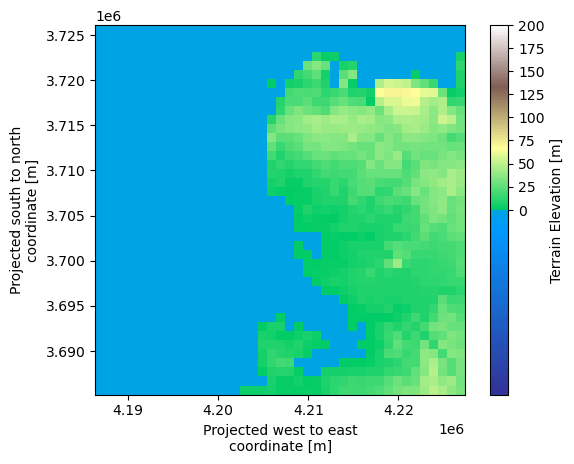
[35]:
plot_dat = site_effects_squeezed["site_elev"]
pwio.plot.raster_plot(plot_dat, color_scale_limits=[0, 200]);
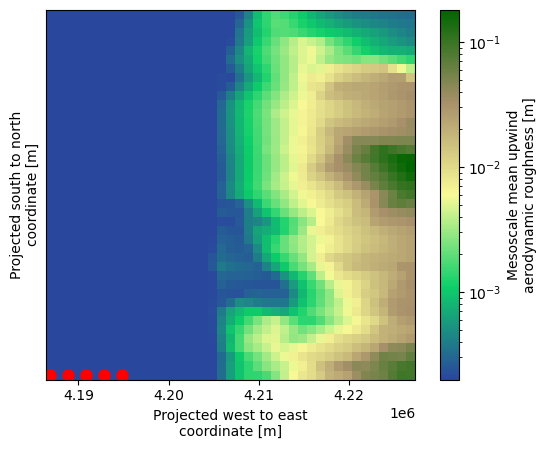
[37]:
plot_dat = site_effects_squeezed["z0meso"].sel(sector=270)
raster_map = pwio.plot.raster_plot(
    plot_dat,
    pts=points.isel(point=slice(0,10,2))
)
[ ]: