ERA5 validation
[1]:
import numpy as np
import pandas as pd
import xarray as xr
import matplotlib.pyplot as plt
from wind_validation import validate, create_report
Using the Tall tower dataset and ERA5 data
A nice source of data for validation of wind simulations is the Tall Tower dataset (see link at the end of the page for the paper). It contains data from more than 200 tall meteorological masts around the world that have been quality checked. In this example we will compare these data with the global reanalysis from ERA5. The ERA5 data have been generated by running the numerical weather prediction model from the ECMWF in hindcast mode using data assimilation on the historical data from many different data sources, including from satellites and routine weather stations. Due to it’s global spatial coverage and decadal time coverage the model has a rather coarse grid spacing of about ~25 km.
To make it easy to run this package without external depencies, we included the ERA5 data and a site from the tall tower dataset. Here, the datasets obs and mod were obtained by installing the tatoda package and running the following code:
import tatoda
obs = tatoda.read_data('Chinook')
obs = obs.sel(time='2010')
mod = tatoda.read_data('Chinook',dataset="ERA5")
mod = tatoda.make_era5_as_obs(mod, obs)
The result of this is that we have modelled time series from the ERA5 data and the observations from the Tall tower dataset at the Chinook site in the west of the US. We will open these by using open_dataset:
[2]:
mod = xr.open_dataset("data/ts_mod.nc")
obs = xr.open_dataset("data/ts_obs.nc")
For a fair validation we want to compare the same time stamps from model and observations. Therefore we first have to ensure that the sampling output are the same. Afterwards we also have to make sure that both wind speed and wind direction are set to ‘not available’ where either of them were not reporting any values. Also we have to select the time stamp from the model output where observations are available. This is all already done above in the call make_era5_as_obs. For more example how
to do this, see the first example notebook RUNE_validation.ipynb.
[3]:
mod["wind_speed"] = mod["wind_speed"].where(~np.isnan(obs.wind_speed) & ~np.isnan(obs.wind_direction))
mod = mod.dropna(dim="time")
obs = obs.dropna(dim="time")
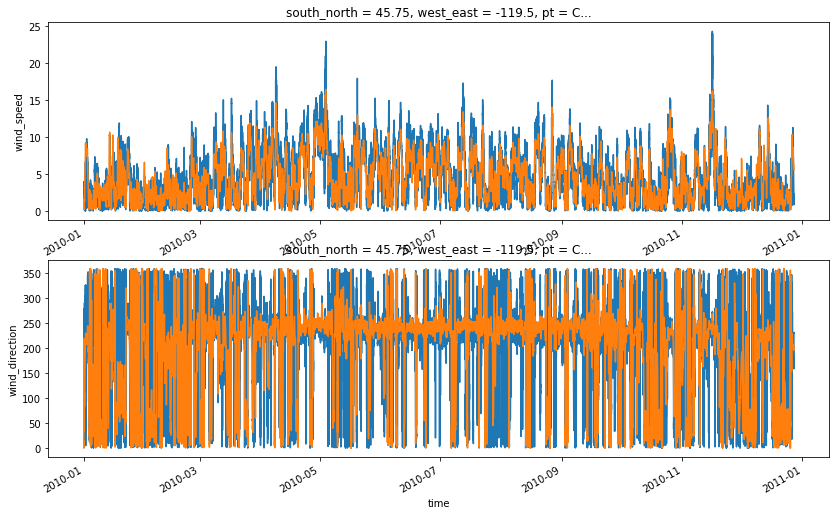
We can now plot the data to get an overview of the time series
[4]:
fig, (ax1, ax2) = plt.subplots(2, 1, figsize=(14, 8))
obs['wind_speed'].plot(ax=ax1)
mod['wind_speed'].plot(ax=ax1)
obs['wind_direction'].plot(ax=ax2)
mod['wind_direction'].plot(ax=ax2)
[4]:
[<matplotlib.lines.Line2D at 0x7f513421b280>]
Inspect the model & observation datasets:
[5]:
print(mod)
<xarray.Dataset>
Dimensions:         (height: 1, time: 51758)
Coordinates:
    south_north     float64 ...
    west_east       float64 ...
    pt              object ...
    crs             int8 ...
  * height          (height) int32 50
  * time            (time) datetime64[ns] 2010-01-01T00:05:00.000008940 ... 2...
Data variables:
    wind_speed      (time, height) float64 1.251 0.76 0.2764 ... 5.621 5.552
    wind_direction  (time, height) float64 14.95 12.3 0.2317 ... 203.6 204.2
[6]:
print(obs)
<xarray.Dataset>
Dimensions:         (time: 51758)
Coordinates:
  * time            (time) datetime64[ns] 2010-01-01T00:05:00.000008940 ... 2...
    west_east       float32 ...
    south_north     float32 ...
    height          float32 ...
    crs             int8 ...
Data variables:
    wind_speed      (time) float32 3.631 3.576 3.51 3.428 ... 2.542 2.175 2.325
    wind_direction  (time) float32 278.4 265.5 251.5 252.0 ... 208.6 232.0 230.9
Attributes:
    tower_name:       chinook
    institution:      Bonneville Power Administration
    boom_directions:  Not available
    location:         US
    offshore:         no
    tower_type:       Met mast
    creation_time:    2019-06-07-T15:03:26Z
    links:            https://transmission.bpa.gov/BUSINESS/OPERATIONS/WIND/M...
    history:
We now input the two time series and perform the validation according to the diagram.
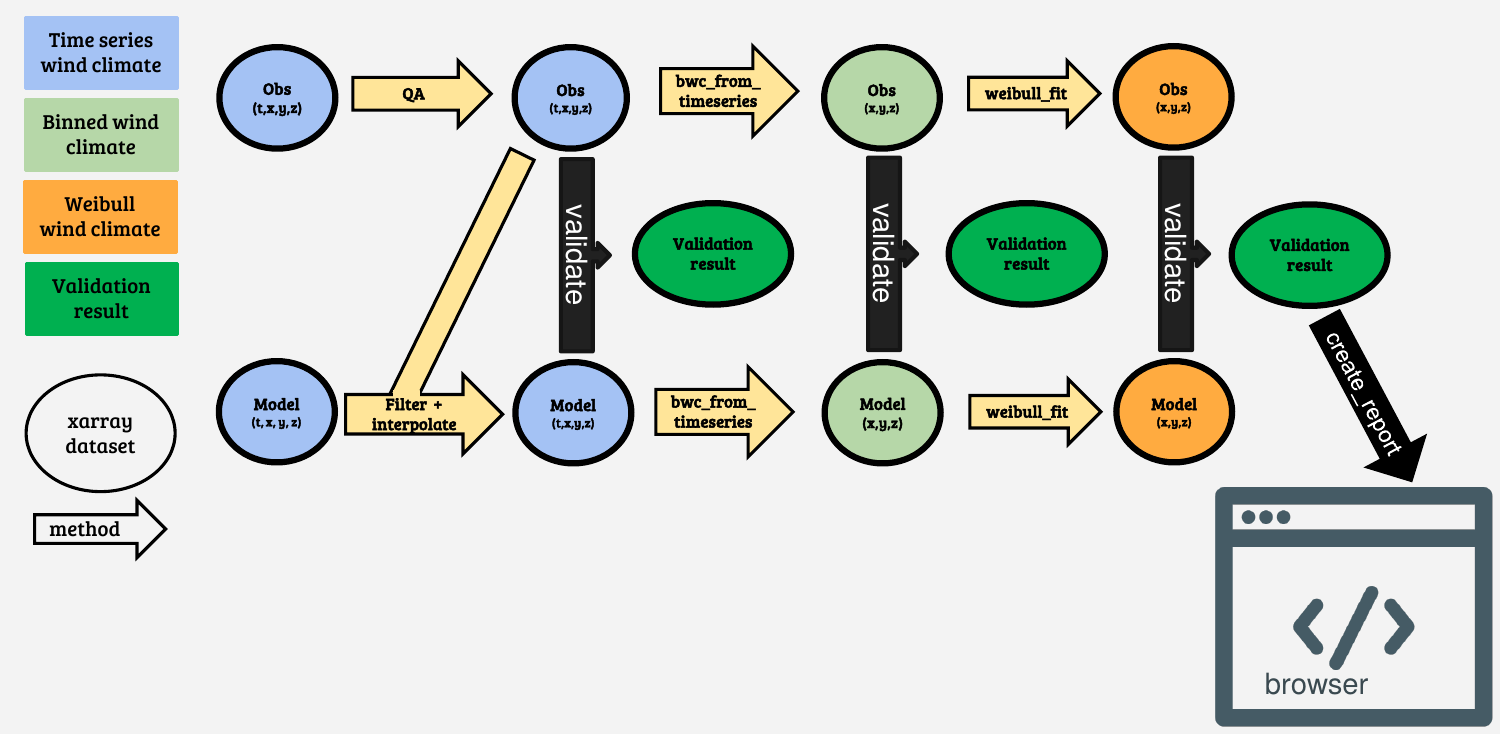
The actual validation is done by calling validate function on the two time series objects that have been create above.
[7]:
result = validate(obs, mod)
print(result)
<xarray.Dataset>
Dimensions:                   (height: 1)
Coordinates:
    west_east                 float32 ...
    south_north               float32 ...
  * height                    (height) int32 50
    crs                       int8 ...
    pt                        object ...
Data variables: (12/27)
    obs_wind_speed_mean       float32 4.406
    obs_wind_speed_std        float64 3.322
    obs_wind_direction_cmean  float64 236.7
    obs_wind_direction_cstd   float64 79.65
    obs_power_density_mean    float32 162.3
    obs_air_density_mean      float32 1.225
    ...                        ...
    wind_direction_cmae       (height) float64 45.5
    power_density_me          (height) float64 -32.31
    power_density_mpe         (height) float64 -19.9
    power_density_mae         (height) float64 32.31
    power_density_mape        (height) float64 19.9
    air_density_mpe           (height) float64 -1.946e-06
Attributes:
    tower_name:       chinook
    institution:      Bonneville Power Administration
    boom_directions:  Not available
    location:         US
    offshore:         no
    tower_type:       Met mast
    creation_time:    2019-06-07-T15:03:26Z
    links:            https://transmission.bpa.gov/BUSINESS/OPERATIONS/WIND/M...
    history:
    format:           timeseries
We can make a sector variable by calling the function wd_to_sector. After that we can also perform sectorwise validation by grouping the variable according to sector.
[8]:
from windkit.wind import wd_to_sector
sector = wd_to_sector(obs['wind_direction'])
sector.name = 'sector'
result_sec = validate(obs, mod, by=sector)
print(result_sec)
<xarray.Dataset>
Dimensions:                   (height: 1, sector: 12)
Coordinates:
  * sector                    (sector) float64 0.0 1.0 2.0 3.0 ... 9.0 10.0 11.0
    west_east                 float32 -119.5
    south_north               float32 45.83
  * height                    (height) int32 50
    crs                       int8 0
    pt                        <U7 'Chinook'
Data variables: (12/27)
    obs_wind_speed_mean       (sector) float32 2.174 2.999 2.951 ... 1.932 1.722
    obs_wind_speed_std        (sector) float64 1.623 1.924 1.905 ... 1.439 1.145
    obs_wind_direction_cmean  (sector) float64 1.432 30.26 59.21 ... 299.1 329.8
    obs_wind_direction_cstd   (sector) float64 8.892 8.517 8.722 ... 8.527 8.512
    obs_power_density_mean    (sector) float32 20.71 40.05 39.48 ... 16.56 8.971
    obs_air_density_mean      (sector) float32 1.225 1.225 1.225 ... 1.225 1.225
    ...                        ...
    wind_direction_cmae       (sector, height) float64 69.43 51.82 ... 76.82
    power_density_me          (sector, height) float64 1.359 -12.55 ... 10.3
    power_density_mpe         (sector, height) float64 6.561 -31.32 ... 114.8
    power_density_mae         (sector, height) float64 1.359 12.55 ... 10.3
    power_density_mape        (sector, height) float64 6.561 31.32 ... 114.8
    air_density_mpe           (sector, height) float64 -1.946e-06 ... -1.946e-06
Attributes:
    tower_name:       chinook
    institution:      Bonneville Power Administration
    boom_directions:  Not available
    location:         US
    offshore:         no
    tower_type:       Met mast
    creation_time:    2019-06-07-T15:03:26Z
    links:            https://transmission.bpa.gov/BUSINESS/OPERATIONS/WIND/M...
    history:
    format:           timeseries
Validation at all sites
We can also validate the whole Tall tower dataset, instead of only the Chinook site. Because this scripts downloads large amount of data we have already included the .nc file here. You can check the script validate_era5_using_tatoda.py in the examples directory if you want to know how you can make this dataset yourself. The file era5_vs_tatoda_time_series.nc contains the results from all sites from the Tall tower dataset. It is obtained in the same way as for the single site, but
instead calling the validate() method on many different sites.
[9]:
result = xr.open_dataset("data/era5_vs_tatoda_time_series.nc")
print(result)
<xarray.Dataset>
Dimensions:                                        (point: 464)
Coordinates:
    south_north                                    (point) float64 ...
    west_east                                      (point) float64 ...
    crs                                            int8 ...
    height                                         (point) float64 ...
    name                                           (point) object ...
Dimensions without coordinates: point
Data variables: (12/47)
    obs_wind_speed_min                             (point) float32 ...
    obs_wind_speed_max                             (point) float32 ...
    obs_wind_speed_mean                            (point) float32 ...
    obs_wind_speed_median                          (point) float32 ...
    obs_wind_speed_std                             (point) float32 ...
    obs_wind_speed_var                             (point) float32 ...
    ...                                             ...
    power_density_mape                             (point) float64 ...
    air_dens_mpe                                   (point) float64 ...
    wind_direction_cme                             (point) float64 ...
    wind_direction_cmae                            (point) float64 ...
    wind_direction_crmse                           (point) float64 ...
    wind_direction_circular_median_absolute_error  (point) float64 ...
Attributes:
    tower_name:       42361
    institution:      Shell International E&P
    boom_directions:  Not available
    location:         US
    offshore:         yes
    tower_type:       Petrol Platform
    creation_time:    2019-06-07-T09:32:12Z
    links:            http://ndbc-load.nws.noaa.gov/station_page.php?station=...
    history:
    format:           timeseries
To create a report we can call create_report. This will open an html file in your browser where you can study the comparison in more detail.
[10]:
create_report(result, obs_name="Observations", mod_name="Model")
HTML report saved in: /tmp/tmpkrcdw89o.html
A couple of interesting things can be observed: the ERA5 data largely underestimate the wind speeds for many of the sites. This can be related to the course resolution (~25 km) of the ERA5 data. It can therefore not model microscale effects, that might be relevant at many of the sites in the Tall tower dataset, because masts are frequently placed on hill tops or mountains. In the report you can see all the sites on a map and you can click on each of the sites to explore the errors. Plots of the error distributions are available as well.
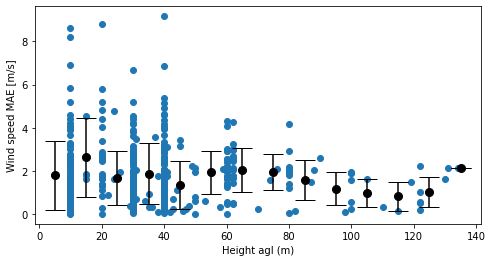
Finally, we can group the data by any variably by using the groupby functionality from xarray. For example, we can create a discrete variable from any properties of the dataset and use that to group all the error metrics and statistics. Below we stratify the dataset by different bins of height to investigate model error as a function of height. For each group, we compute the mean and standard deviation in each bin and create a plot. It can be seen that the errors are usually largest close to
the surface, where microscale effects that the ERA5 model cannot resolve, play the largest role.
[11]:
bins = np.linspace(0, 140, 15)
centers = 0.5 * (bins[1:] + bins[:-1])
labels = [f"({l},{h}]" for l, h in zip(bins[:-1], bins[1:])]

grps = result.groupby_bins(result["height"], bins, labels=labels)
fig, ax = plt.subplots(1, 1, figsize=(8, 4))
ax.scatter(result["height"], result["wind_speed_mae"], color="C0")
ax.errorbar(
    centers,
    grps.mean(skipna=True)["wind_speed_mae"],
    yerr=grps.std(skipna=True)["wind_speed_mae"],
    fmt="o",
    markersize=8,
    capsize=10,
    color="k",
)
ax.set(xlabel="Height agl (m)", ylabel="Wind speed MAE [m/s]")
plt.show()
References:
Ramon, J., Lledó, L., Pérez-Zanón, N., Soret, A., and Doblas-Reyes, F. J.: The Tall Tower Dataset: a unique initiative to boost wind energy research, Earth Syst. Sci. Data, 12, 429–439, https://doi.org/10.5194/essd-12-429-2020, 2020.
Tall tower website, https://talltowers.bsc.es/ (accessed on 04-03-2022)
Hersbach, H, Bell, B, Berrisford, P, et al. The ERA5 global reanalysis. Q J R Meteorol Soc. 2020; 146: 1999– 2049. https://doi.org/10.1002/qj.3803